APSA stands for “Automated Protein Structure Analysis.” APSA represents the protein backbone as a smooth line in 3-dimensional space, which can be accurately described by its curvature and torsions. The secondary structural units of proteins possess characteristic curvature and torsion patterns, which make it easy to distinguish an α-helix from 310 or π-helix, a left-handed Β-strand from a right-handed Β-strand, an ideal helix from bent or kinked helix, or a stretched turn from a curled turn. Similarly, the spatial orientation of a secondary structure is easily obtained so that super-secondary structures and with the latter the motifs of a protein. This information is used to describe the tertiary protein structure.
The original idea of developing APSA was based on the work with the Unified Reaction Valley Approach (URVA) of E. Kraka and D. Cremer. [A1] There, the reaction path of a chemical reaction is presented by a curve in multi-dimensional space, which is characterized by arc length, curvature, and torsion (the latter quantities are related to energy transfer and energy dissipation during the chemical reaction). The work with URVA led Dieter Cremer to the question whether protein folding can be also described by a conformational path, in which the protein backbone changes its shape in a typical way. From there, it was just a small step to represent the backbone itself as a smooth line in 3-dimensional (3D) space, which can be characterized by arc length, curvature, and torsion.
[A1] See, e.g., From Molecular Vibrations to Bonding, Chemical Reactions, and Reaction Mechanism, D. Cremer and E. Kraka, Curr. Org. Chem., 14, 1524-1560 (2010) and references cited therein.
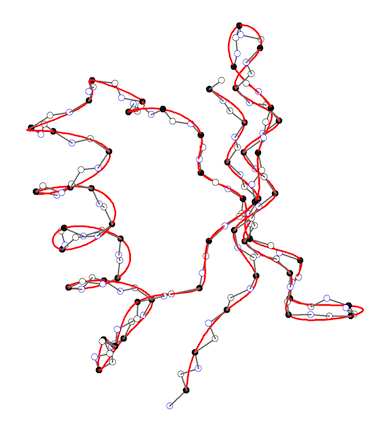
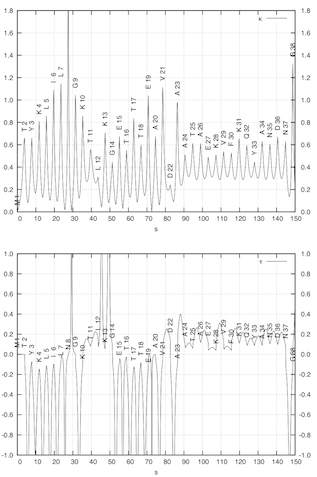
APSA describes the backbone of a protein as a smooth line in 3D space passing through the positions of the C-alpha atoms as the anchor points of the residues. The backbone line is generated by using a cubic spline fit method. (left figure) Hence, APSA uses a coarse-grained representation of the backbone, which has the advantage that conformational details within a residue are not needed. The backbone line is then described as any curved line by the Frenet “coordinates” arc length, curvature, and torsion. The curvature and torsion diagrams given as a function of the arc length are characteristic for a protein and can be used for the recognition and similarity comparison of secondary tertiary protein structure. (right figure) They convert the 3D structure into a 2D-representations, which can be considered as the structural spectra of the protein. The structural spectra are converted into a simple character coded (1D representation of the protein). In this way, APSA diagrams accurately reflect the conformation of the backbone, effectively reducing 3D structure information into 2D and 1D representations that are the basis for rapid structure analysis and similarity comparisons.
Find out more about APSA >>APSA Reference:
Ranganathan, S., Izotov, D., Kraka, E. and Cremer, D. (2009), Description and recognition of regular and distorted secondary structures in proteins using the automated protein structure analysis method. Proteins: Structure, Function, and Bioinformatics, 76: 418–438. doi: 10.1002/prot.22357.
APSA database
APSA analysis of over 2,000 proteins are available online. Proteins (~20,000) with no chain breaks and with resolution ≤ 2.0 and R-factor ≤ 0.3 were grouped by sequence similarity (cutoff of 30%). These proteins are selected as representative of each group.
[1] F.C.Bernstein, T.F.Koetzle, G.J.Williams, E.E.Meyer Jr., M.D.Brice, J.R.Rodgers, O.Kennard, T.Shimanouchi, M.Tasumi, "The Protein Data Bank: A Computer-based Archival File For Macromolecular Structures," J. of. Mol. Biol., 112 (1977): 535.
Access the Database >>Thanks for using the APSA database.