I) Introduction
The primary goal of Chemistry is to control chemical reactions with the purpose of generating useful, non-toxic, and non-dangerous materials with desirable properties in an economic way. Control of chemical reactions implies the understanding of their mechanism.
What is the mechanism of a chemical reaction? In experimental chemistry, a reaction mechanism is defined as the sequence of elementary reactions leading from reactants to products. It is not common in experimental chemistry to use the term reaction mechanism in the case of a one-step reaction with or without transition state. - In a quantum chemical investigation of a reaction, one describes the properties of the reaction complex at any transient point along the reaction path to obtain a detailed analysis of the chemical processes. For example, the dissociation of H2 is an elementary reaction without transition state but with a distinct reaction mechanism consisting of two reaction phases. The first phase is characterized by a ”reaction complex” with continuously elongated H-H bond. Any bonding interaction ceases when the electron pair responsible for bonding undergoes spin decoupling to an open-shell singlet. Then, Coulomb repulsion facilitates lengthening of the H,H interaction distance. A second reaction phase starts, which is characterized by H atoms quickly drifting apart. It ends when the energy asymptote representing two completely free H atoms is reached. The reaction mechanism of the H2 dissociation is obtained by describing the chemical process of bond breaking in the two reaction phases. Hence, the theoretical definition of the reaction mechanism is much more detailed and is based on the identification of the different reaction phases and the description of the chemical processes in these phases.
What are chemical processes? In a chemical reaction, one or more reactants interconvert into new products. Normally, this implies one or more chemical processes each of which leads to a change in chemical bonding. More specifically, we define bond breaking or bond forming as chemical processes to distinguish them from other processes such as van der Waals processes, conformational processes, (de)solvation processes, self-assembly (self-organized) processes, electron-transfer processes, excitation processes, or ionization processes. All these processes can occur in the course of a chemical reaction and therefore are investigated by chemists although they are often more physical than chemical in nature.
The understanding of chemical processes implies an understanding of the chemical bond.
What is a chemical bond? The chemical bond is a conceptual quantity rather than a measurable, well-defined quantity. However, the concept of the chemical bond is the most useful concept in Chemistry and therefore some chemists believe that bond properties can be measured. This is not correct: One can measure molecular properties and relate them, within a given model, to model-based descriptions of the chemical bond. URVA uses for example the description of bond strength in terms of bond stretching force constants derived from adiabatic vibrational modes.
What are adiabatic vibrational modes? Each molecule with N atoms possesses 3N-6 normal vibrational modes. The normal vibrational modes are always more or less delocalized in a polyatomic molecule, which means that the whole molecule is moving during a vibration and not just an isolated group. For example, a bond stretching vibration leads to a coupling with other stretching and/or bending vibrations and as such is no longer isolated. Cremer, Konkoli, and Kraka developed the concept of the adiabatic internal coordinate modes that are completely localized within a structural unit such as a bond, a triatomic group, a functional group, etc. as specified by the internal coordinate that drives an adiabatic mode. In selected cases, there are experimental means to measure localized vibrational modes. In all cases, these measured modes turn out to be identical with the adibatic vibrational modes.
In which way do adiabatic vibrational modes describe the chemical bond? Adiabatic bond stretching modes are characterized by a stretching frequency and a stretching force constant. The adiabatic stretching vibrations probe the strength of a chemical bond without breaking it. Hence, they are the perfect tool to “measure” bond strength via the bond stretching force constants without being contaminated by coupling with other vibrational motions.
What is a reaction complex? The reaction complex is the union of all reactants being converted into the reaction products. For example in the Diels-Alder reaction of ethene with butadiene yielding cyclohexene, the reaction complex is the union of ethene and butadiene that converts into cyclohexene, i.e. the number of atoms remains constant whereas the number of bonds or the number of vibrational degrees of freedoms can change.
How does chemical change start? Bond breaking is initiated by a molecular vibration. Therefore, the study of molecular vibration is essential for the study of chemical reactions. This is done by utilizing the adiabatic vibrational modes, which are local and can be associated with the internal coordinates of a reaction complex.
How does one analyze the mechanism of a chemical reaction? For this purpose, we follow the path of the reaction complex on the potential energy surface (PES). If the reaction complex consists of N atoms, we have to analyze in the general case the changes of 3N-6 geometrical parameters along the reaction path. For large reaction complexes, this is no longer useful especially as we do not know which changes are important and which are not. For this reason, we analyze the path of the reaction complex rather than the complex itself. The path can be described by just calculating the reaction path direction via the path tangent and the curvature of the path via the curvature vector. Given these properties of the path as a function of the path length s leads to a complete description of the reaction mechanism.
Why is the reaction path curvature important? The chemical processes of bond breaking and bond forming are indicated by a curving of the path. The curving of the path is measured by the length of the curvature vector, i.e. the scalar curvature. If the path is straight we have either a physical change or a steady chemical change after the chemical processes have been initiated. Hence, the curvature indicates when a chemical bond is finally formed and when the bond breaking starts. This is a reliable indicator for identifying the reaction phases of a chemical reaction.
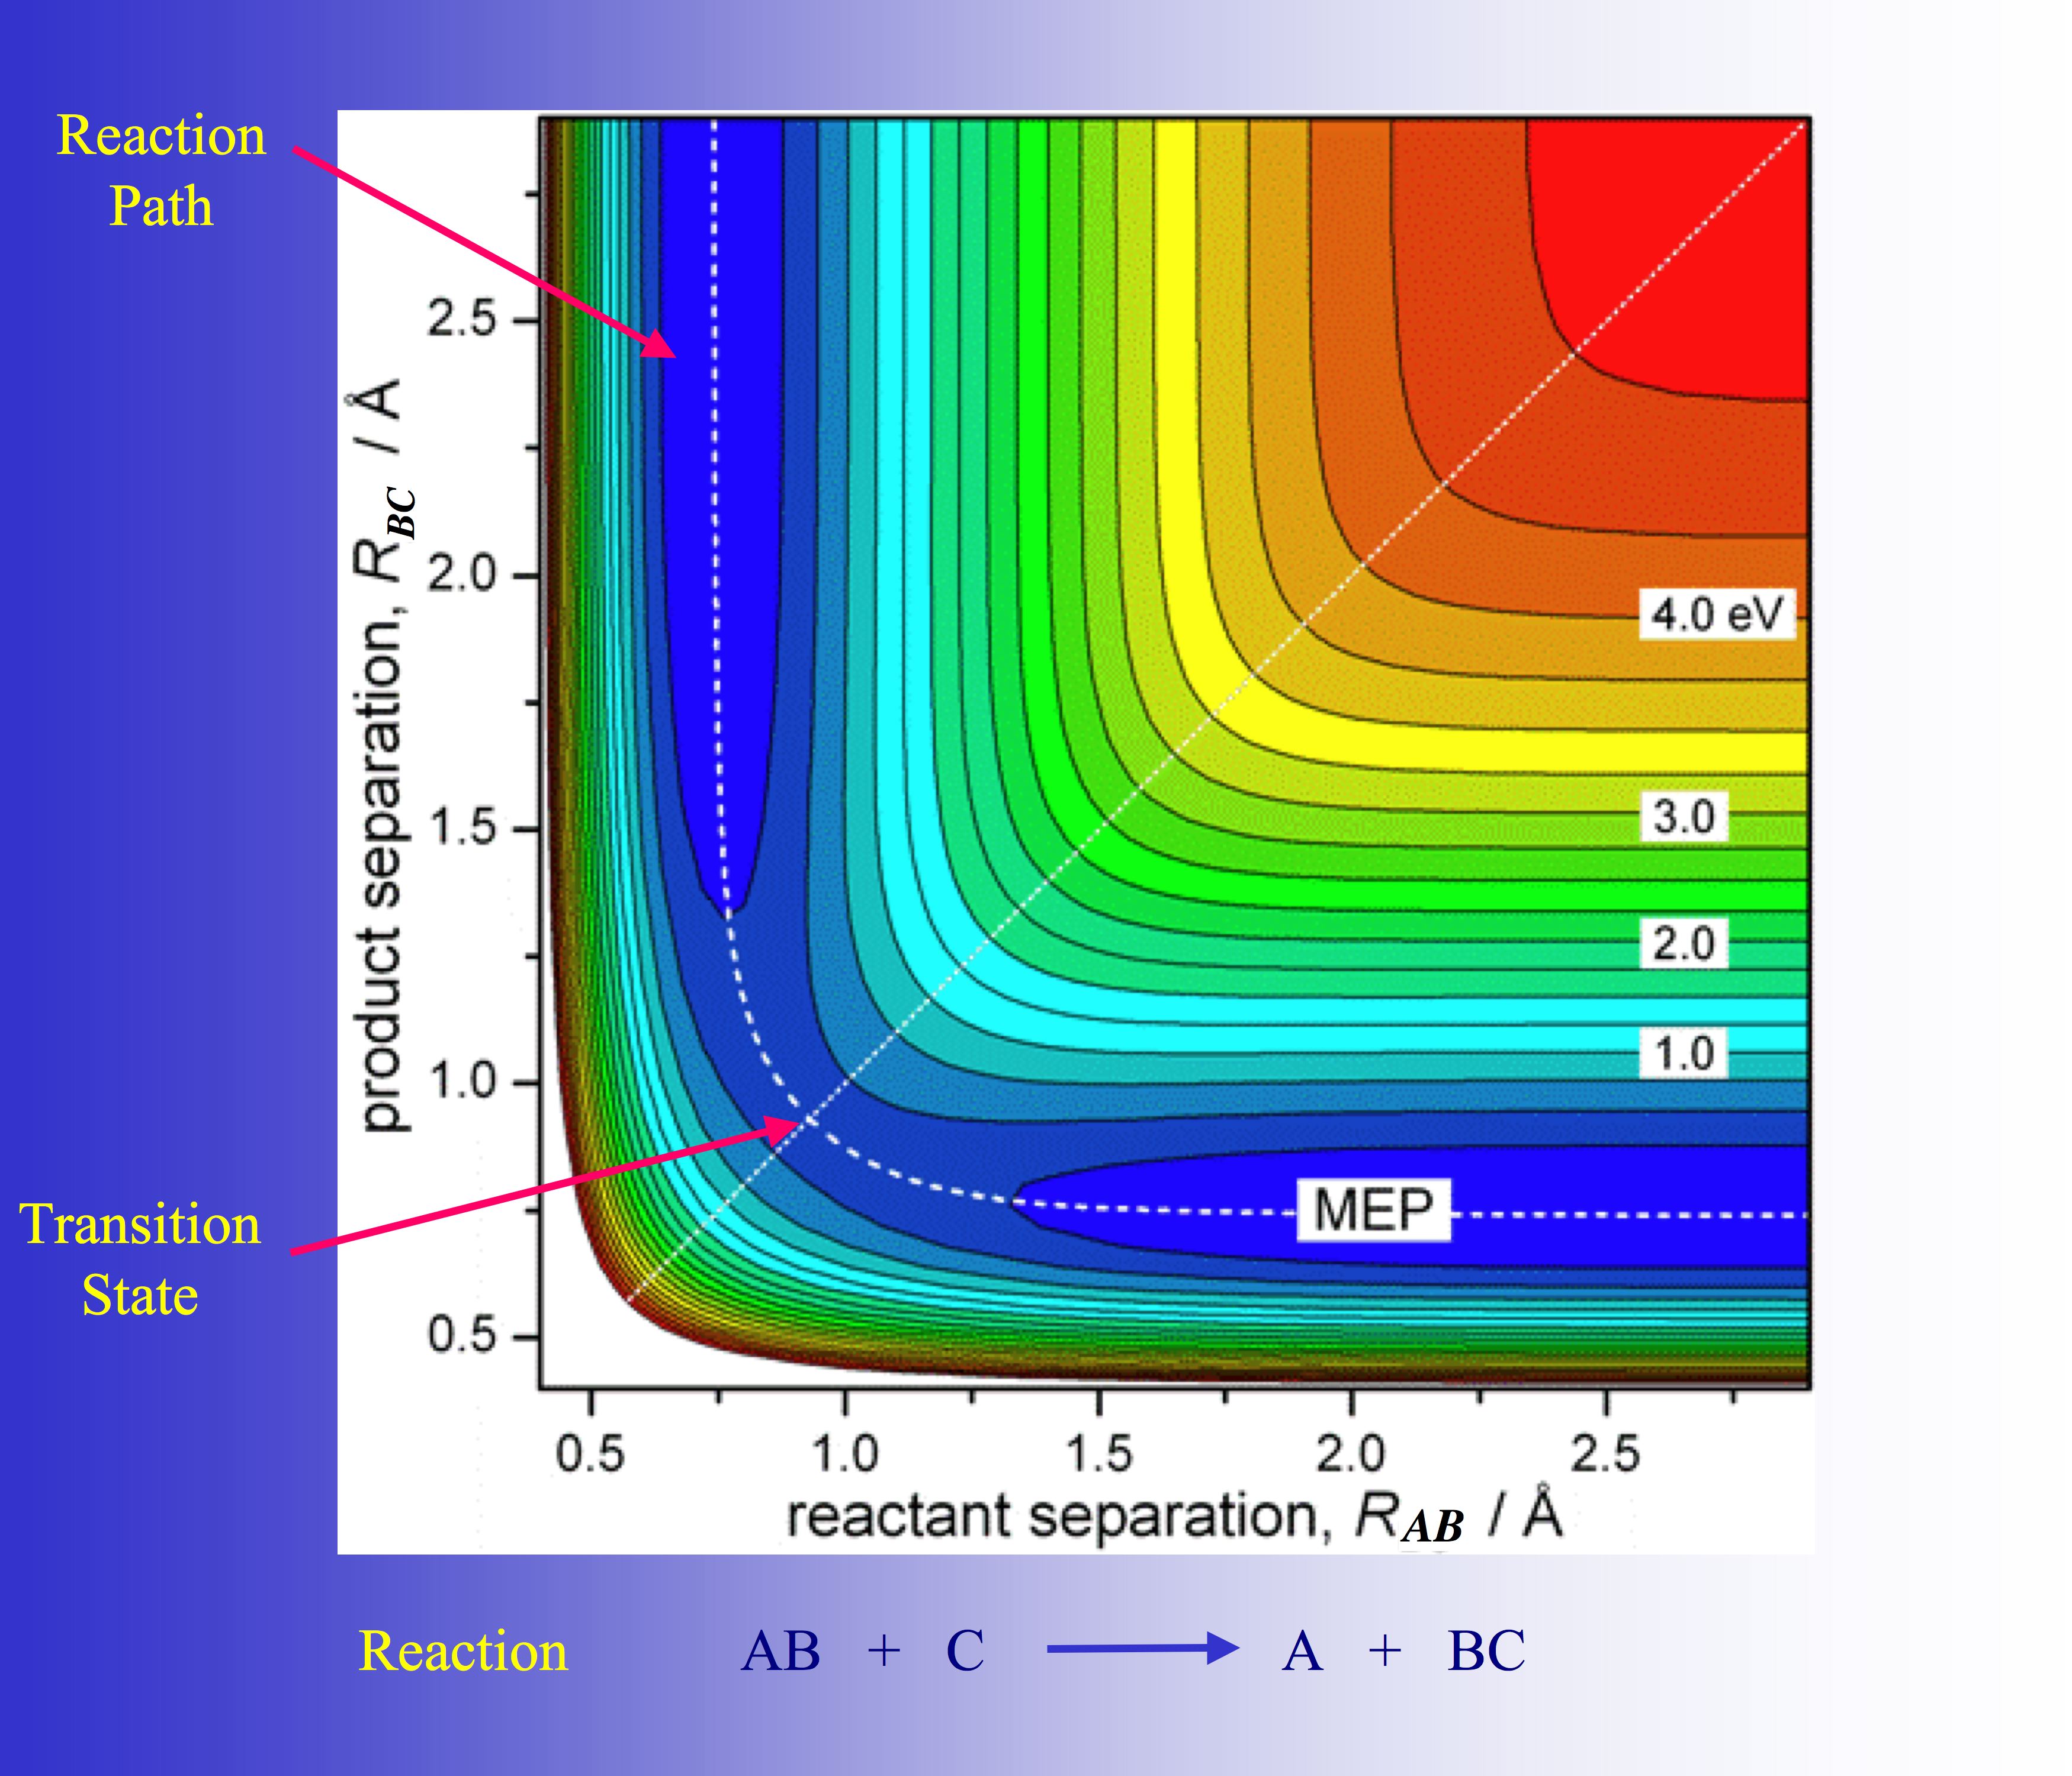
In this figure the reaction path of a model reaction AB + C yielding A + BC is shown. It is strongly curved in the region where the chemical processes of bond breaking and bond forming occur. This is typical of chemical reactions.
What is a reaction phase? A reaction phase starts with a minimum of the scalar curvature and ends at the subsequent curvature minimum. At the maximum of the curvature in between, the chemical change is strongest. Curvature peaks indicate bond breaking or forming whereas smaller curvature enhancements indicate smaller distortions of the reaction complex before or after bond changes. Each reaction phase can be characterized by a typical structure of the reaction complex. These structures together with the reaction phases along the reaction path make it possible to describe the reaction mechanism in a language that is familiar to chemists in general.
What are hidden intermediates and hidden transition states? The structures associated with the different reaction phases correspond to transient points on the PES and therefore are not observable. However, the URVA analysis provides information how these transient points can become, after a change of the reaction conditions (change of the substituents or change of the environment), real intermediates and real energy transition states. If this can be proven by suitable calculations or by experiment, we speak of hidden intermediates and hidden transition states.
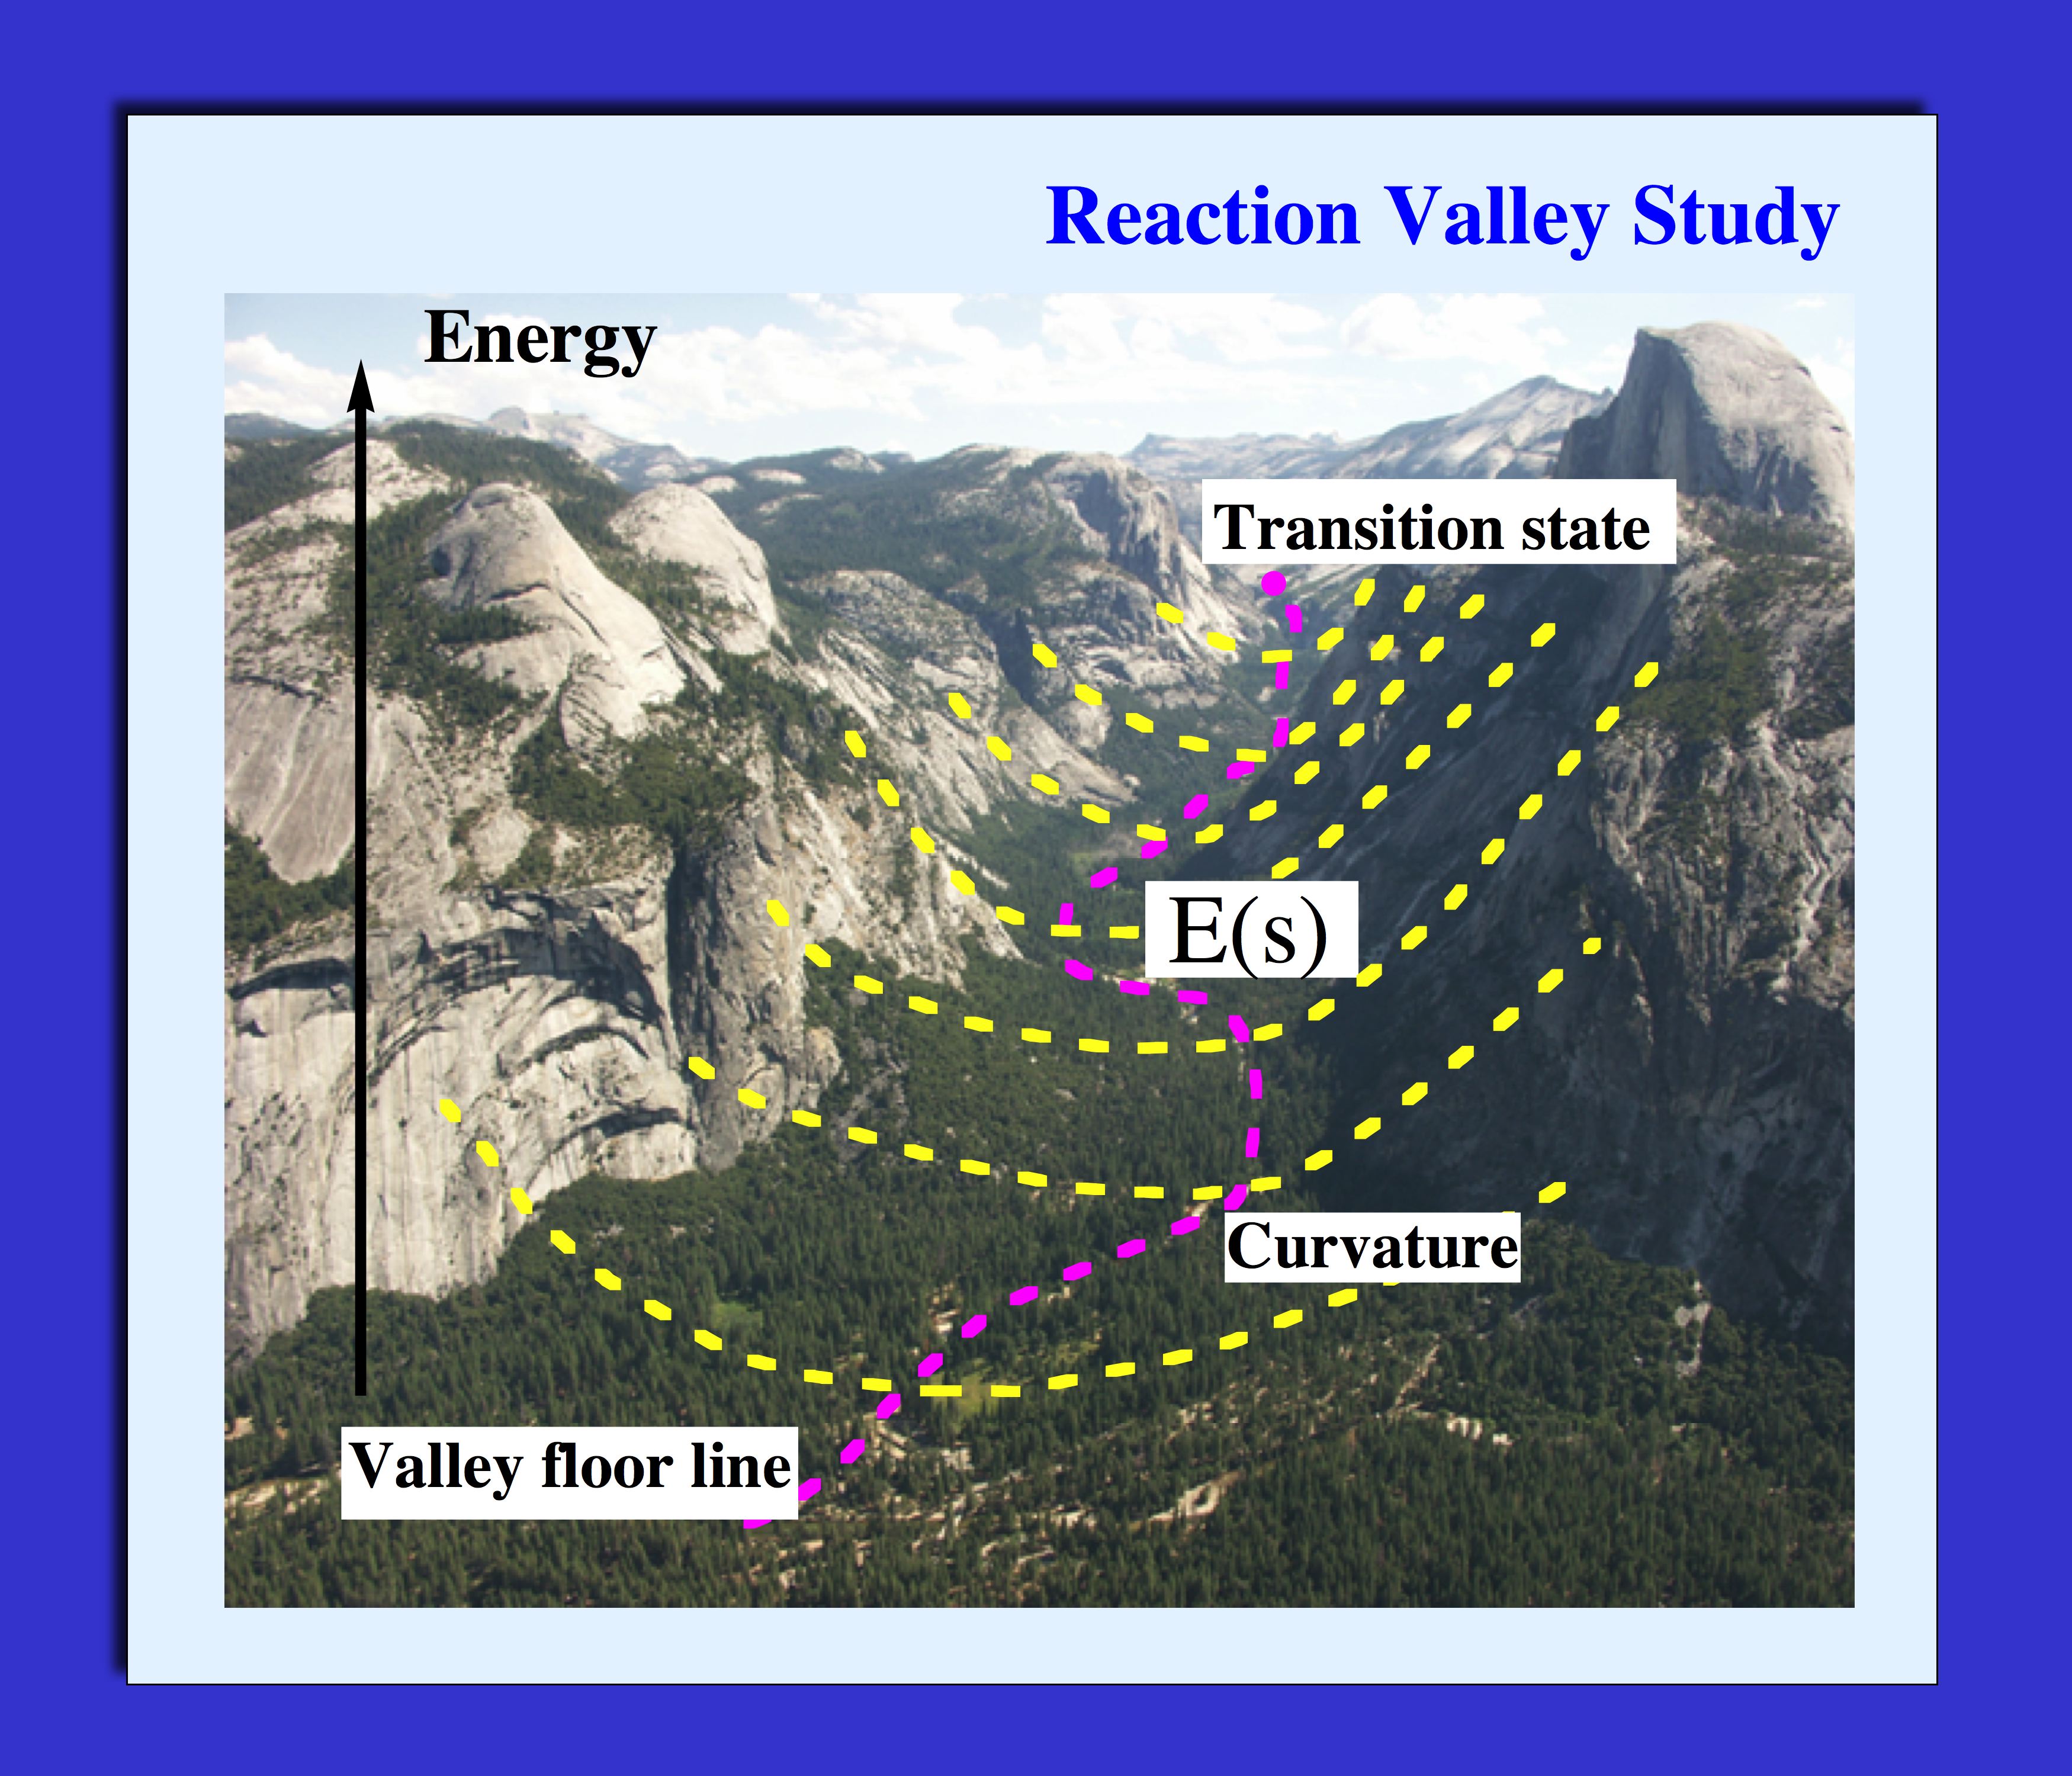
Why do we investigate the reaction valley? The reaction path is curved in the chemically most relevant parts. Whenever it is curved the translational motion of the reaction complex along the path can couple with some of the vibrational motions of the reaction complex. This coupling can lead to energy transfer and this energy transfer can strongly affect the rate of the chemical reaction. Therefore, all vibrations of the reaction complex are calculated during the translational motion. These vibrational motions describe via their force constants the curvature of the PES perpendicular to the path and by this a valley. Therefore, we describe the reaction valley in addition to the reaction path, which follows the floor line of the valley.
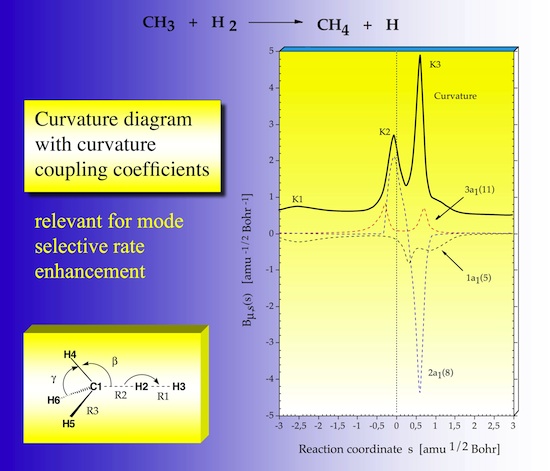
What are curvature coupling coefficients? The curvature coupling coefficients identify those vibrational modes and those positions along the reaction path where energy can be transferred from a specific vibrational mode into the translational mode along the path. Their values adopt maximal (or minimal) values at these positions. This can be used by experimentalists for a mode selective rate enhancement.
What is mode selective rate enhancement? Laser spectroscopists can tune their Laser on the frequency of that vibrational mode that couples with the path motion, and pump energy in this mode for the purpose of channeling it via the coupling mechanism into the translational motion of the reaction complex. In this way, the rate of a reaction is selectively enhanced.
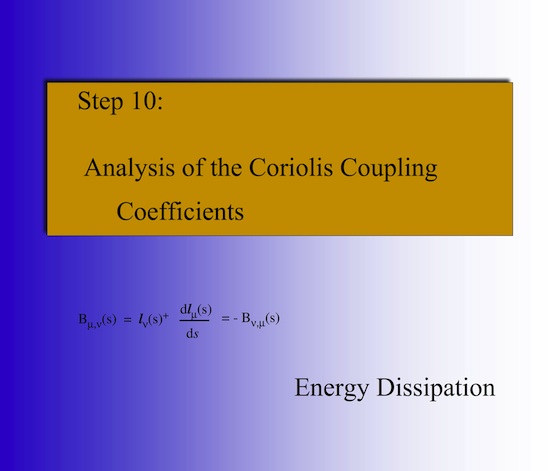
What are Coriolis coupling coefficients? Mode selective rate enhancement does not work if the mode in question couples with another mode via Coriolis coupling and transfers its energy before energy transfer into the reaction path motion is possible. This is called energy dissipation. Coriolis coupling and energy dissipation takes place at the avoided crossings of the vibrational eigenstates along the reaction path. Therefore it is important to calculate all avoided crossings when the reaction complex passes through the reaction valley.
How do we analyze the reaction path curvature? Calculating the curvature coupling and Coriolis coupling coefficients derived from the normal vibrational modes provides insight into energy transfer and energy dissipation. It does provide little insight into the reaction mechanism in the way an experimental chemist wants to know about it. This information we obtain from the adiabatic curvature coupling coefficients. They provide the information what bond-stretching mode, bending, or torsional mode is responsible for the curvature maximum. Since the adiabatic vibrational modes are associated with the internal coordinates of the reaction complex, the adiabatic curvature coupling coefficients provide exactly that information about a given reaction phase that is needed for its chemical characterization.
II) URVA References
Adiabatic Vibrational Modes:
- 1)A New Way of Analyzing Vibrational Spectra I. Derivation of Adiabatic Internal Modes, Z. Konkoli and D. Cremer, Int. J. Quant. Chem. 67, 1 (1998).
- 2)A New Way of Analyzing Vibrational Spectra II. Comparison of Internal Mode Frequencies, Z. Konkoli, J. A. Larsson and D. Cremer, Int. J. Quant. Chem. 67, 11 (1998).
- 3)A New Way of Analyzing Vibrational Spectra III. Characterization of Normal Vibrational Modes in Terms of Internal Vibrational Modes, Z. Konkoli and D. Cremer, Int. J. Quant. Chem. 67, 29 (1998).
- 4)A New Way of Analyzing Vibrational Spectra IV. Application and Testing of Adiabatic Modes within the Concept of the Characterization of Normal Modes, Z. Konkoli, J. A. Larsson and D. Cremer, Int. J. Quant. Chem. 67, 41 (1998).
- 5)New Developments in the Analysis of Vibrational Spectra: On the Use of Adiabatic Internal, Vibrational Modes, D. Cremer, J. A. Larsson, and E. Kraka, Theoretical and Computational Chemistry, Volume 5, Theoretical Organic Chemistry, C. Parkanyi, Edt., Elsevier, Amsterdam, 1998, p.259.
Description of the Chemical Bond:
- 1)Generalization of the Badger Rule Based on the Use of Adiabatic Vibrational Modes in Vibrational Modes in Computational IR Spectroscopy, E. Kraka, JA Larsson and D. Cremer, J. Grunenberg, Ed.; Wiley, New York, 2010, p.105-149.
- 2)From Molecular Vibrations to Bonding, Chemical Reactions, and Reaction Mechanism, D. Cremer and E. Kraka, Curr. Org. Chem., 14, 1524-1560 (2010).
- 3)Structure, vibrational spectra, and unimolecular dissociation of gaseous 1-fluoro-1-phenethyl cations. J. Oomens, E. Kraka, M.K. Nguyen, T. H. Morton J. Phys. Chem., 112, 10774-83 (2008).
- 4)Characterization of CF bonds with multiple-bond character: bond lengths, stretching force constants, and bond dissociation energies. E. Kraka and D. Cremer, Chem. Phys. Chem. 10, 686-98 (2009).
Unified Reaction Valley Approach: Basic Theory
- 1)Unified Reaction Valley Approach: Mechanism of the Reaction CH3 + H2 → CH4 + H, Z. Konkoli, E. Kraka, and D. Cremer, J. Phys. Chem. A 101, 1742 (1997).
- 2)Diabatic Ordering of Vibrational Normal Modes in Reaction Valley Studies, Z. Konkoli, D. Cremer, and, E. Kraka, J. Comput. Chem. 18, 1282 (1997).
- 3)Reaction Path Hamiltonian and its Use for Investigating Reaction Mechanism, E. Kraka in Encyclopedia of Computational Chemistry, P.v.R. Schleyer, N.L. Allinger, T. Clark, J. Gasteiger, P.A. Kollman, H.F. Schaefer III, P.R. Schreiner, Eds. John Wiley, Chichester, UK, 1998, Vol. 4, p.2437
- 4)From Molecular Vibrations to Bonding, Chemical Reactions, and Reaction Mechanism, D. Cremer and E. Kraka, Curr. Org. Chem., 14, 1524-1560 (2010).
- 5)Computational Analysis of the Mechanism of Chemical Reactions in Terms of Reaction Phases: Hidden Intermediates and Hidden Transition States, E. Kraka and D. Cremer, Acc. Chem. Res., 43, 591-601 (2010).
- 6)Reaction Path Hamiltonian and the Unified Reaction Valley Approach, E. Kraka, Wiley Interdisciplinary Reviews: Computational Molecular Science, Wiley, New York, 2011.
Unified Reaction Valley Approach: Applications
- 1)Unified Reaction Valley Approach: Mechanism of the Reaction CH3 + H2 → CH4 + H, Z. Konkoli, E. Kraka, and D. Cremer, J. Phys. Chem. A 101, 1742 (1997).
- 2)The mechanism of the reaction FH+H2C = CH2 → H2C-CFH3. Investigation of hidden intermediates with the unified reaction valley approach, D. Cremer, A. A. Wu, and E. Kraka, Phys. Chem. Chem. Phys. 3, 674 (2001).
- 3)(a) Insights into the Mechanisms of Chemical-reactions - Reaction Paths for Chemical-reactions T.H. Dunning, Jr., E. Kraka, R. A. Eades Faraday Discussions, 84, 427-440 (1987).
- (b) Calculation and Characterization of Reaction Valleys For Chemical-reactions T.H. Dunning Jr., L.B. Harding, E. Kraka Supercomputer Algorithms For Reactivity, Dynamics And Kinetics Of Small Molecules Book Series: Nato Advanced Science Institutes Series, Series C, Mathematical And Physical Sciences, 277, 57-71 (1989).
- (c) Characterization of Molecular Potential Energy Surfaces: Critical Points, Reaction Paths and Reaction Valleys, E. Kraka, T. H. Dunning, Jr., in "Advances in Molecular Electronic Structure Theory: The Calculation and Characterization of Molecular Potential Energy Surfaces", T.H. Dunning. Jr., Edt, JAI Press, Inc., Greenwich, 1990, p.129.
- 4)Mechanism of the Diels-Alder reaction studied with the united reaction valley approach: Mechanistic differences between symmetry-allowed and symmetry-forbidden reactions, E. Kraka, A. Wu, and D. Cremer, J. Phys. Chem. A 107, 9008 (2003).
- 5)Mechanism and dynamics of organic reactions: 1,2-H shift in methylchlorocarbene, E. Kraka and D. Cremer, J. Phys. Org. Chem. 15, 431 (2002).
- 6)A stunning example for a spontaneous reaction with a complex mechanism: the vinylidene-acetylene cycloaddition reaction, E. Kraka H. Joo and D. Cremer Mol. Phys. 19-20, 2667-2685 (2010).
Barrier-less Chemical Reactions
- 1)Finding the Transition State of Quasi-barrierless Reactions by a Growing String Method for Newton Trajectories: Application to the Dissociation of Methylenecyclopropene and Cyclopropane W. Quapp, E. Kraka, and D. Cremer, J. Chem. Phys. A, 111, 11287-11293 (2007).
- 2)The Mechanism of a Barrierless Reaction: Hidden Transition State and Hidden Intermediate in the Reaction of Methylene with Ethene H. Joo, E. Kraka, W. Quapp, and D. Cremer Mol. Phys., 105, 2697 – 2717 (2007).
III) The Basis for the Mechanistic Study
1. Unified Reaction Valley Approach
The detailed analysis of the mechanism of a chemical reaction can be efficiently carried out utilizing the Reaction Path Hamiltonian of Miller, Handy, and Adams (W.H. Miller. N.C. Handy, J.E. Adams, J. Chem. Phys. 72, 99- 112 (1980)) and the Unified Reaction Valley Approach (URVA) (see References). The chemical conversion of the reaction complex is reflected by the changes in the reaction path direction t(s) and reaction path curvature k(s), both expressed as a function of the path length s (Schematically shown in Figure 1).
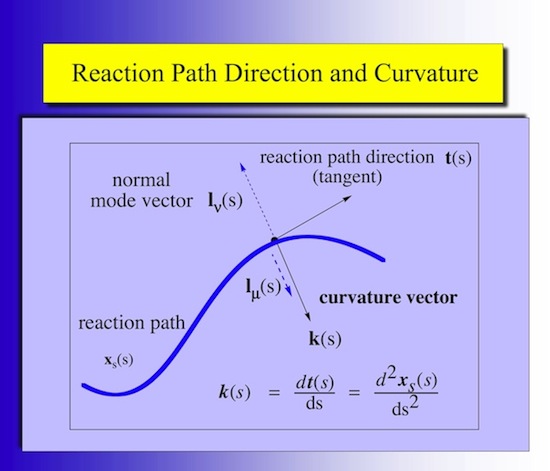
Figure 1. Reaction path (blue) with reaction path tangent vector t(s) and curvature vector k(s) at position s. The curving of the path is the prerequisite for a possible coupling between the translational motion of the reaction complex along the path and a vibrational mode lm(s) orthogonal to the path.
Since the curvature vector k(s) is difficult to analyze in 3N-7 dimensions (N: number of atoms in the reaction complex; the reaction complex is defined as the union of reactants (or products)), the scalar reaction path curvature k(s) is plotted along s The scalar curvature shown in Figure 2 identifies the mechanistic details of a chemical reaction. The investigation of more than 100 different chemical reactions has revealed that the reaction path has to be curved in those regions where the chemical processes take place. The maxima of the reaction path curvature along s identify the locations of chemical change, which come to an end at the neighboring curvature minima. (Figure 3)
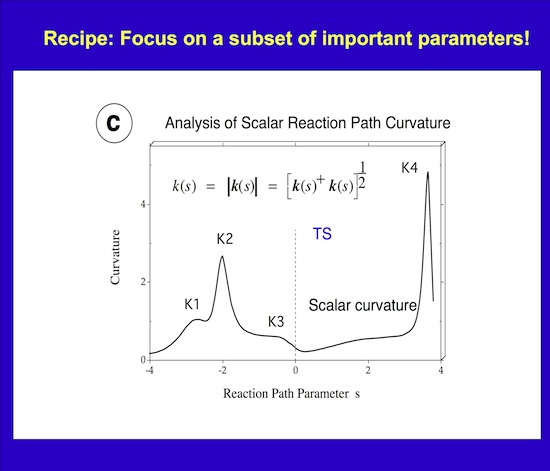
Figure 2. Scalar curvature k(s) shown as a function of the reaction path parameter s.
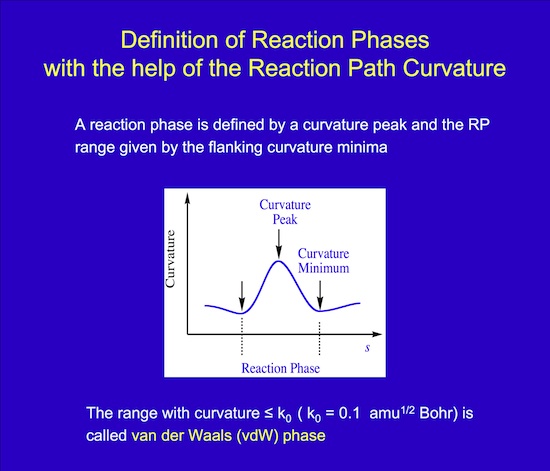
Figure 3. Schematic presentation of a chemical process in form of a maximum of the scalar curvature and the adjoined curvature minima.
This can be used to partition the reaction path and by this the reaction mechanism of a chemical reaction into reaction phases describing different chemical processes of the reaction complex. For example, for many substitution reactions the following pattern is found: i) A contact phase characterized by van der Waals interactions, ii) a preparation phase, in which the reactants prepare for the chemical processes, iii) a transition state phases, in which the chemical processes of bond cleavage and bond formation take place, iv) a product adjustment phase, and finally, v) a separation phase, which corresponds to the contact phase on the reactant side. Utilizing the concept of localized adiabatic vibrational modes that are associated with the internal coordinates qn(s) of the reaction complex /1/, the chemical character of each reaction phase can be identified via the adiabatic curvature coupling coefficients An,s(s) (see Figure 4). These quantities reveal whether a local adiabatic vibrational mode supports (An,s > 0) or resists (An,s < 0) the curving of the path and by this the structural changes of the reaction complex. Just few (M << N) rather than 3N-6 internal coordinates dominate a given reactive changes and, therefore, the (3N-6)-dimensional problem of analyzing reaction mechanism is reduced to a much smaller M-dimensional subspace, which has to be analyzed to describe structural changes of the reaction complex.
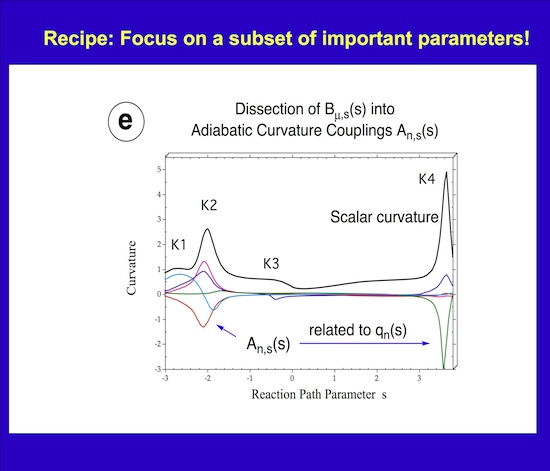
Figure 4. Decomposition of the scalar curvature along the reaction path into adiabatic curvature coupling coefficients (in color) that reveal the importance of a given internal coordinate (bond length, bond angle, etc.) at a given path point s.
Using URVA, the mechanism of a reaction expressed in terms of reaction phases reveals the sequence of chemical processes in the reaction complex and makes it possible to determine those electronic factors that control mechanism and energetics of the reaction. The magnitude of adiabatic curvature coupling coefficients is related to strength and polarizability of the bonds being broken /3/. Transient points along the reaction path are associated with hidden intermediates and hidden transition states that become real intermediates and transition states when the reaction conditions or the substitution pattern of the reaction complex are appropriately changed /9,10 /.
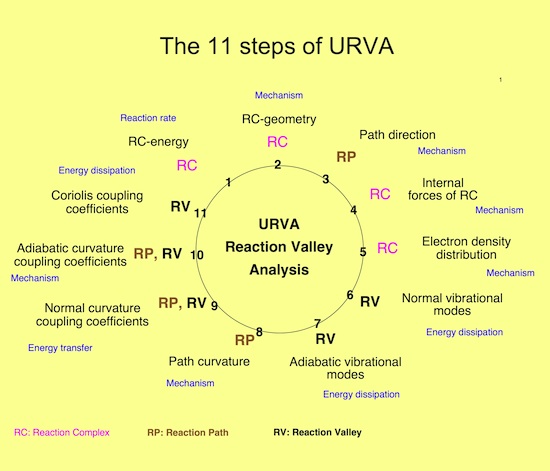
Figure 5. URVA is carried out in 11 steps where the method is programmed in the way that all steps are automatically done at the same time. The reaction complex moves along the reaction path and is described in terms of energy and geometry change, internal forces, electron density distribution, vibrational modes, and other properties. The direction (tangent) vectors and curvature vectors are calculated along the reaction path; these are analyzed then in terms of normal mode curvature couplings (for the study of energy transfer and mode enhanced rate acceleration), adiabatic mode curvature couplings (for the study of reaction mechanism), and Coriolis couplings (for the study of energy dissipation). Guided by the analysis of the scalar curvature, other properties such as the energy density, electric multipoles, polarizability, etc. are analyzed to complement and provide a detailed understanding of the mechanism.
2. Application to the CH3 + H2 hydrogenation reaction
In the following the 11 steps of a URVA analysis will be demonstrated for a simple hydrogenation reaction; the reaction between methyl radical and hydrogen leading to methane and a hydrogen.
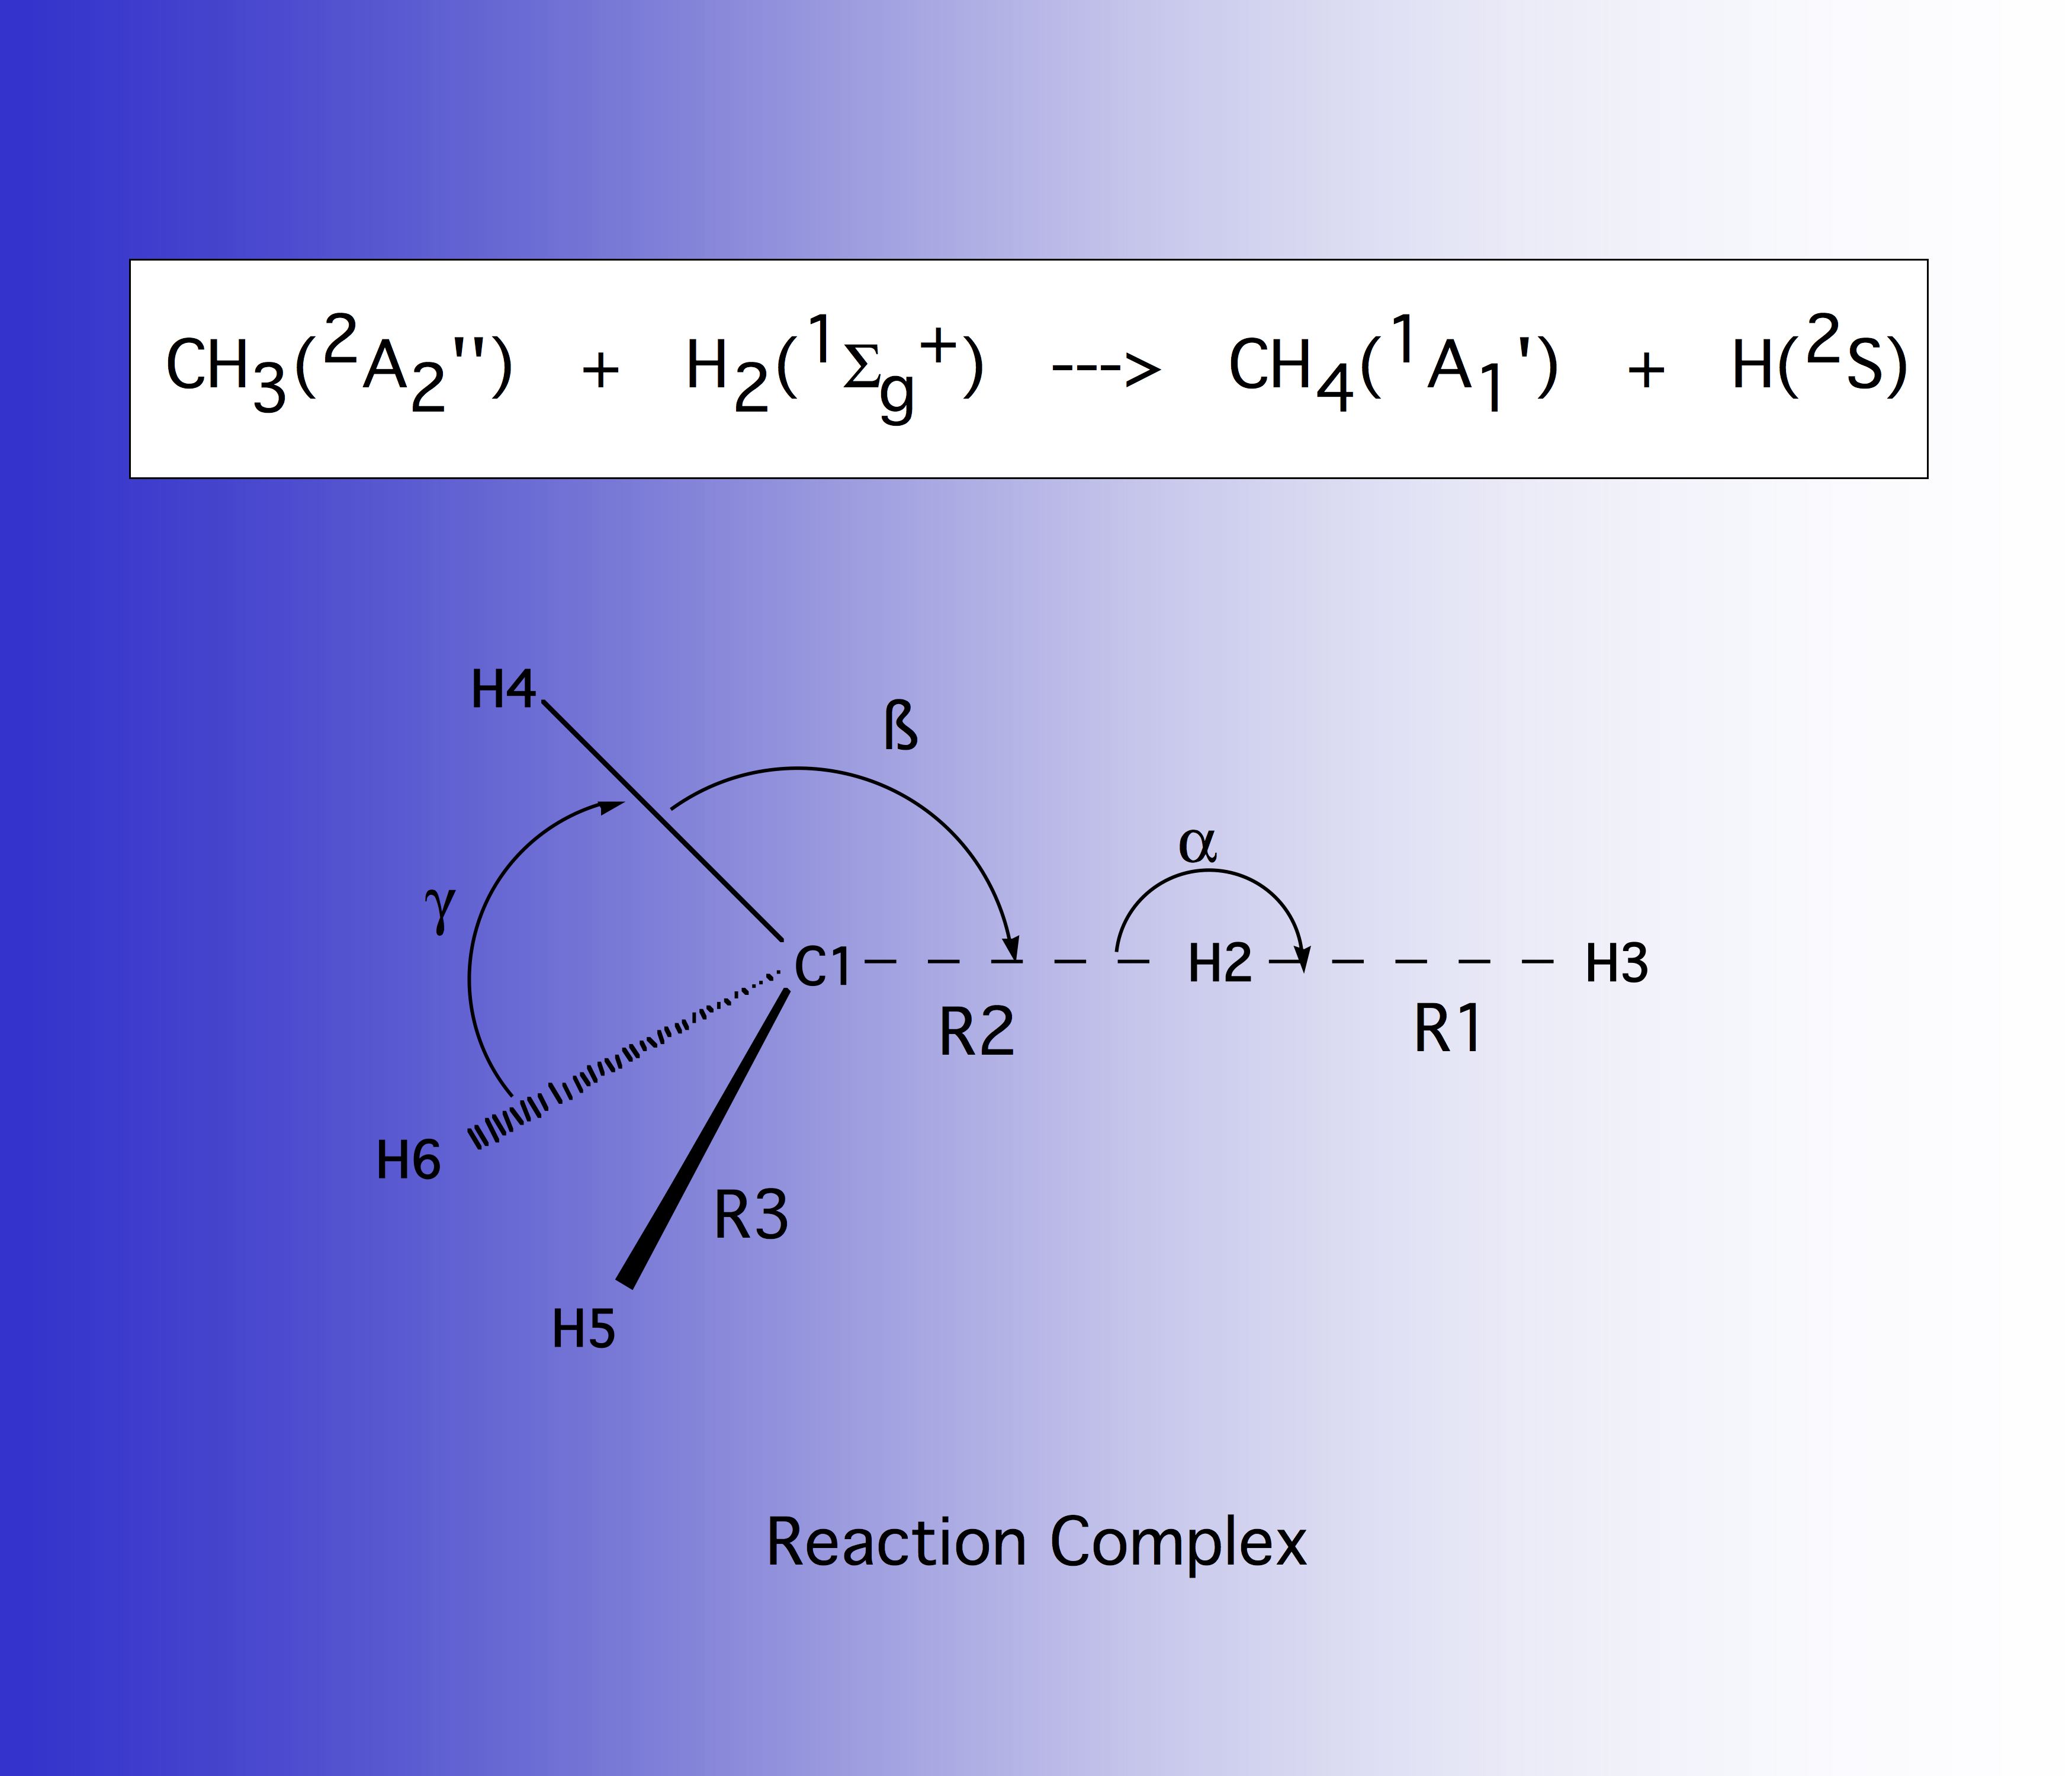
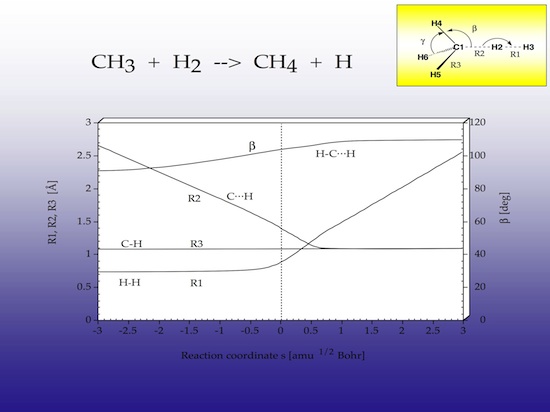
Figure 6 shows the reaction complex together with the internal coordinates that are used to describe the geometrical changes in the complex. The R1 distance gives the HH bond length to be split, R2 gives the approach distance between methyl radical and H2, and R3 the bond lengths of the spectator bonds, that is the bonds that do not directly participate in the reaction.
2.1 Energy
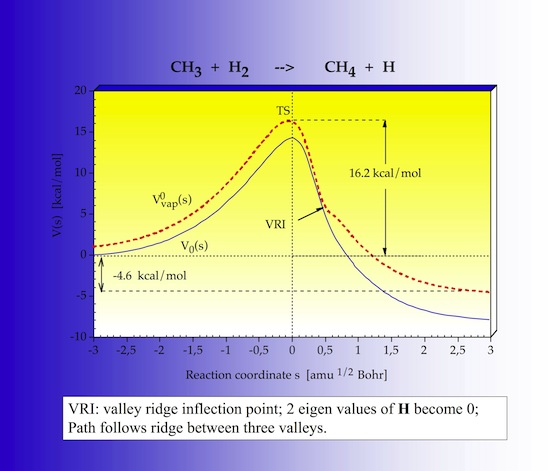
The first step of URVA is the analysis of the energy profile along the reaction path, which is shown in Figure 8. The energy is given in dependence of the IRC s. s = 0 defines the TS, in the entrance channel s values are negative, in the exit channel they are positive. The reaction is slightly exothermic. There is a VRI point after the TS, where two vibrational frequencies become zero and then imaginary. The VRI point one finds if the zero-point energy is evaluated along the reaction path.
2.2 Geometry
2.3 Path direction
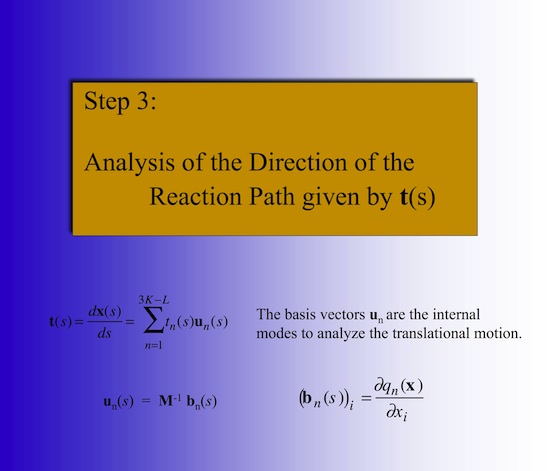
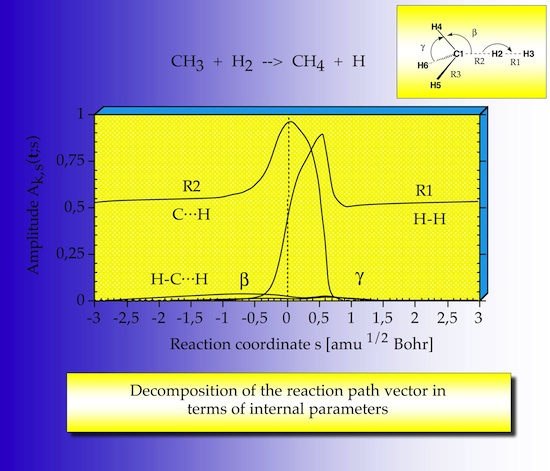
The reaction path direction is analyzed by projecting out the internal coordinate contributions in form of amplitudes so that one can see which internal coordinate dominates the direction of the reaction path. The reaction path direction is dominated by the R2 coordinate in the entrance channel, because R2 is an approach parameter for CH3 and H2; in the exit channel R1 takes this role since it is the approach parameter between methane hydrogen and the H atom. The switch between R2 and R1 does not occur at but after the TS, there are two maxima, which are related to the bond breaking/bond forming process.
2.4 Internal forces
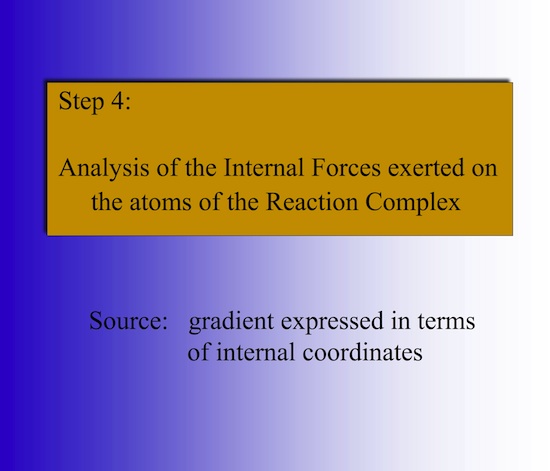
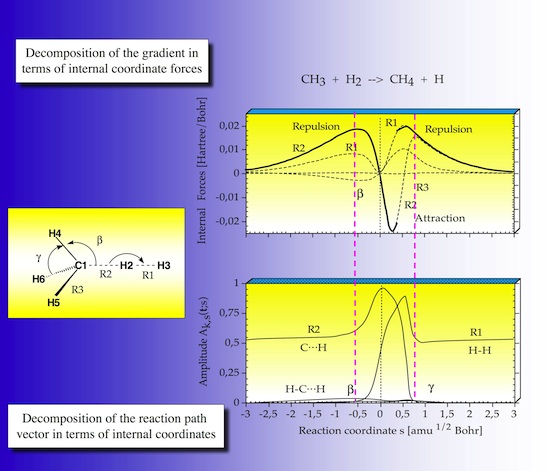
In step 4 of the URVA the forces exerted on the atoms of the reaction complex are analyzed as they develop along the reaction path. In Figure 14 the forces are given as internal coordinate forces.
There are repulsive (positive sign) and attractive (negative sign) forces. Those forces associated with the internal coordinate that dominates the reaction path direction are given in bold print.
In the entrance channel there is first a repulsive force, because of exchange repulsion between CH3 and H2. Before the TS this decreases to become attractive after the TS. In the exit channel the reaction is driven by C,H attraction and then by H,H repulsion. In the TS region indicated by the vertical purple lines the strongest changes occur with regard to the R1, R2 and the beta forces.
2.5 Electron density distribution
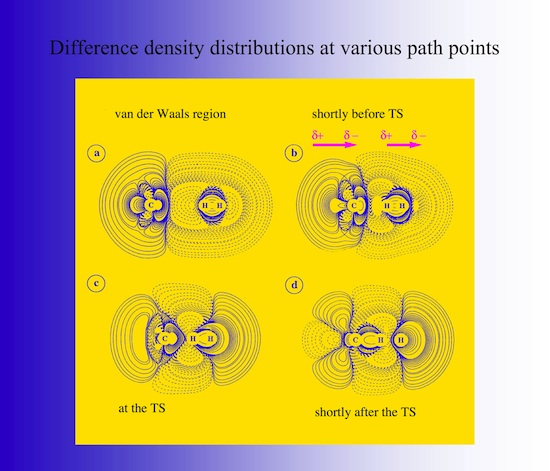
One can understand the changes in the forces by analyzing the electron density distribution of the reaction complex calculated at various points along the reaction path given in Figure 16 in form of electron difference density distributions. Solid lines indicate an increase, dashed lines a decrease of the electron density of the reaction complex relative to the density of the non-interacting reaction partners. In the van der Waals region, exchange repulsion between the molecules leads to a polarization of the density of the reaction partners. The closer the molecules come, the stronger is the polarization. Density is pushed toward the outer H and to the methyl C atom. A bond dipole moment is induced for the H2 molecule and beside repulsive forces inductive forces, that means attractive forces develop. In the TS region the inductive forces balance the repulsive forces, the HH bond breaks and a new CH bond is formed.
2.6 Normal vibrational modes
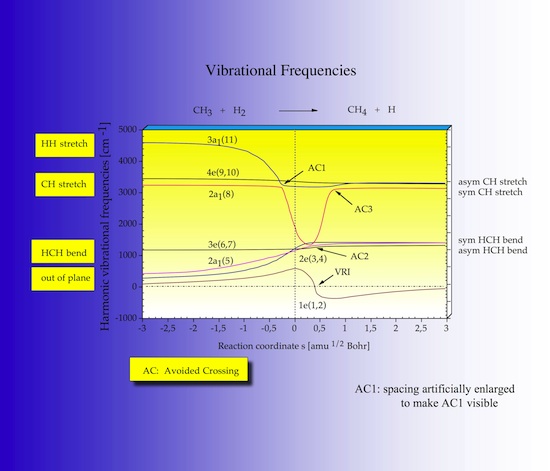
In Figure 17 the 18-7 = 11 vibrational frequencies defining the reaction valley perpendicular to the reaction path of the CH3 + H2 reaction are shown as a function of s. The strongest change along s is found for mode 11 and mode 8. The abbreviation AC stand for avoided crossing of modes of the same symmetry, for example a1 symmetry in this case. The URVA program detects all avoided crossings, which is important for describing any energy transfer between the modes in the correct way.
2.7 Adiabatic Vibrational Modes
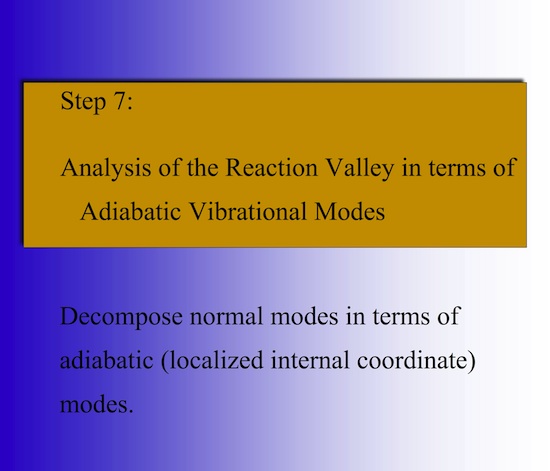
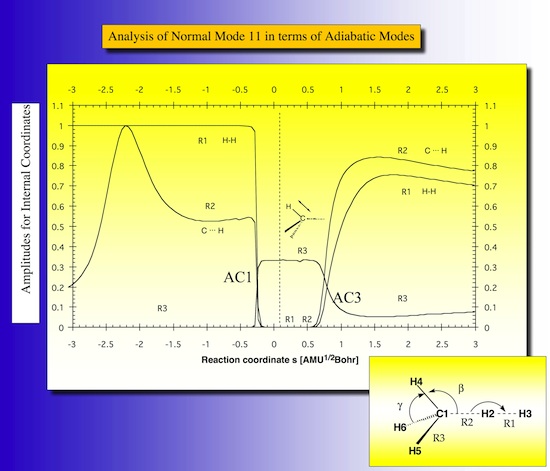
Normal modes are delocalized modes by nature. Therefore they are characterized by decomposition into localized modes associated with internal coordinates used to describe the RC so that a deeper insight into the reaction mechanism is obtained. Figure 20 shows such decomposition for mode 11 in the way that the contributions of the various local modes are given. This is first the HH stretching mode, at the first avoided crossing it becomes a CH stretching mode of a spectator bond and at the second avoided crossing it changes to the stretching mode of the newly formed CH bond. At s = -2.2 both, the HH stretching mode the incoming methyl group contribute to mode 11.
2.8 Reaction Path Curvature
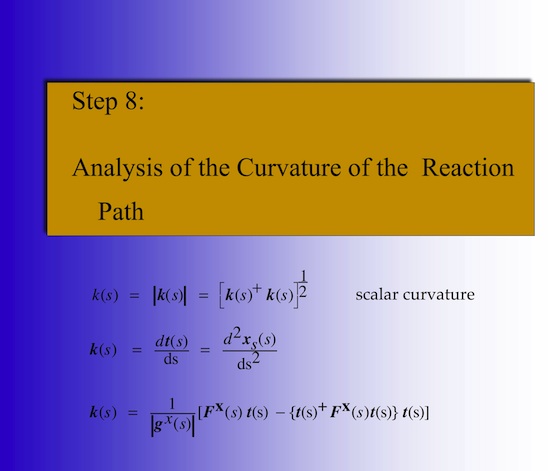
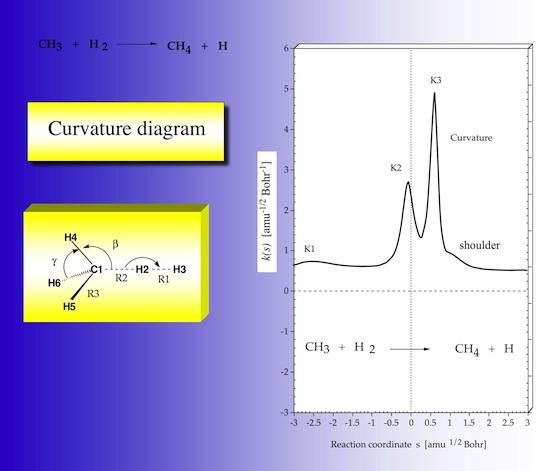
The analysis of the reaction path curvature is a key feature of URVA. In Figure 22 the scalar reaction path curvature k(s) is plotted as a function of s. There are the two strong curvature peaks K2 and K3, which correspond to the locations important chemical changes (like bond breaking and bond forming processes) of the reaction complex. There is a small peak K1 in the entrance channel, which can be associated with a van der Waals interaction. At these locations the translational motion along the reaction path strongly couples with vibrational modes so that an energy transfer becomes possible. For each curvature peak that normal mode can be identified which possesses the strongest coupling with the path motion.
2.9 Normal mode curvature couplings

In Figure 24 the normal mode curvature coupling coefficients are shown in form of dashed lines. They can be positive or negative. Positive curvature couplings support, negative couplings resist chemical change. Each curvature coupling coefficient relates to a specific vibrational mode as indicated in the diagram. As shown in Figure 23, the sum of squares of the curvature coupling coefficients leads to the scalar curvature, which means that a large negative coefficient is responsible for a curvature peak in the same way as a large positive coefficient.
2.10 Coriolis couplings
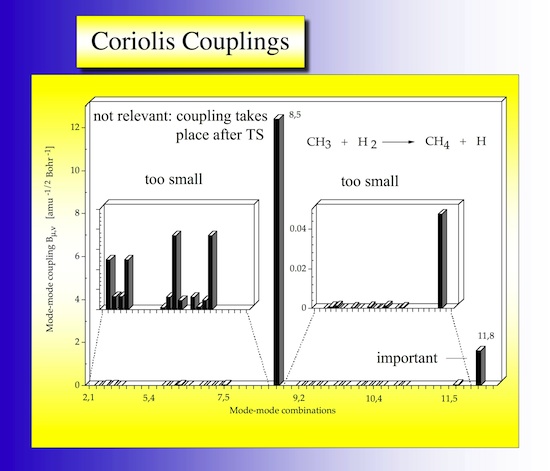
In Figure 26 the coriolis couplings are shown in form of a bar diagram going through all possible combinations. Largest couplings are found for pairs 5,8 and 8,11.
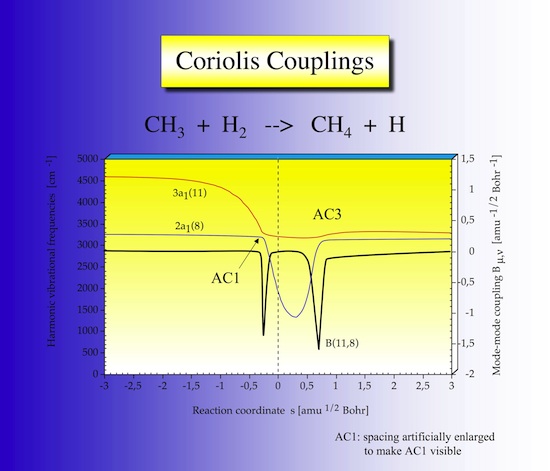
As shown in Figure 27 largest coriolis couplings occur at the locations of avoided crossings.
2.11 Adiabatic curvature couplings
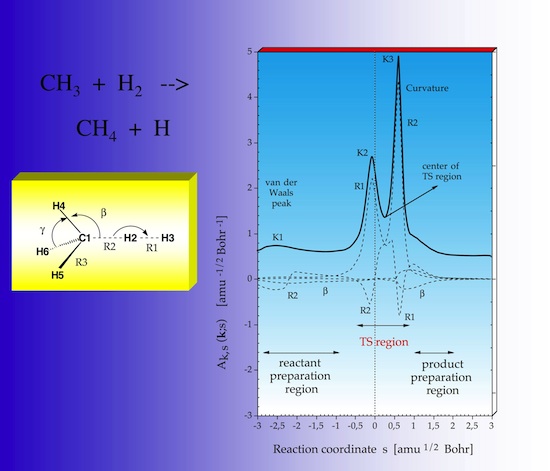
Figure 29 displays the decomposition of the scalar curvature into contributions from localized vibrational modes associated with the internal coordinate used to describe the reaction complex. In this way detailed information about the reaction mechanism is obtained. The HH stretching motion is associated with K2, the CH stretching motion with K3, however the CH mode contributes also to K2 and the HH mode to K3 as can be seen here by the negative R2 and R1 components, which mean that the corresponding internal coordinate motion resists a curving of the path and the electronic structure changes associated with it.